RealtiIntel
A white-label real estate market intelligence platform that turns raw MLS data into client-ready insight.
Insight is a white-label real estate market intelligence platform that turns raw MLS listing data into actionable insight for agents and brokerages. It ingests live listings from the MLS PIN feed (Bridge Data Output API), enriches them with economic data like Federal Reserve 30-year mortgage rates (FRED API), and surfaces everything through interactive dashboards, predictive analytics and client-ready report generators — so agents can price homes accurately, time listings, craft winning offers and present analyses that win listings. It's fully re-brandable per customer, with role-based access separating agent tools from admin data and branding.
- Live MLS data ingestion
- Predictive Market PowerScore
- One-click CMA reports
- 24-month market trends
- White-label re-branding
- Role-based access
Market Overview
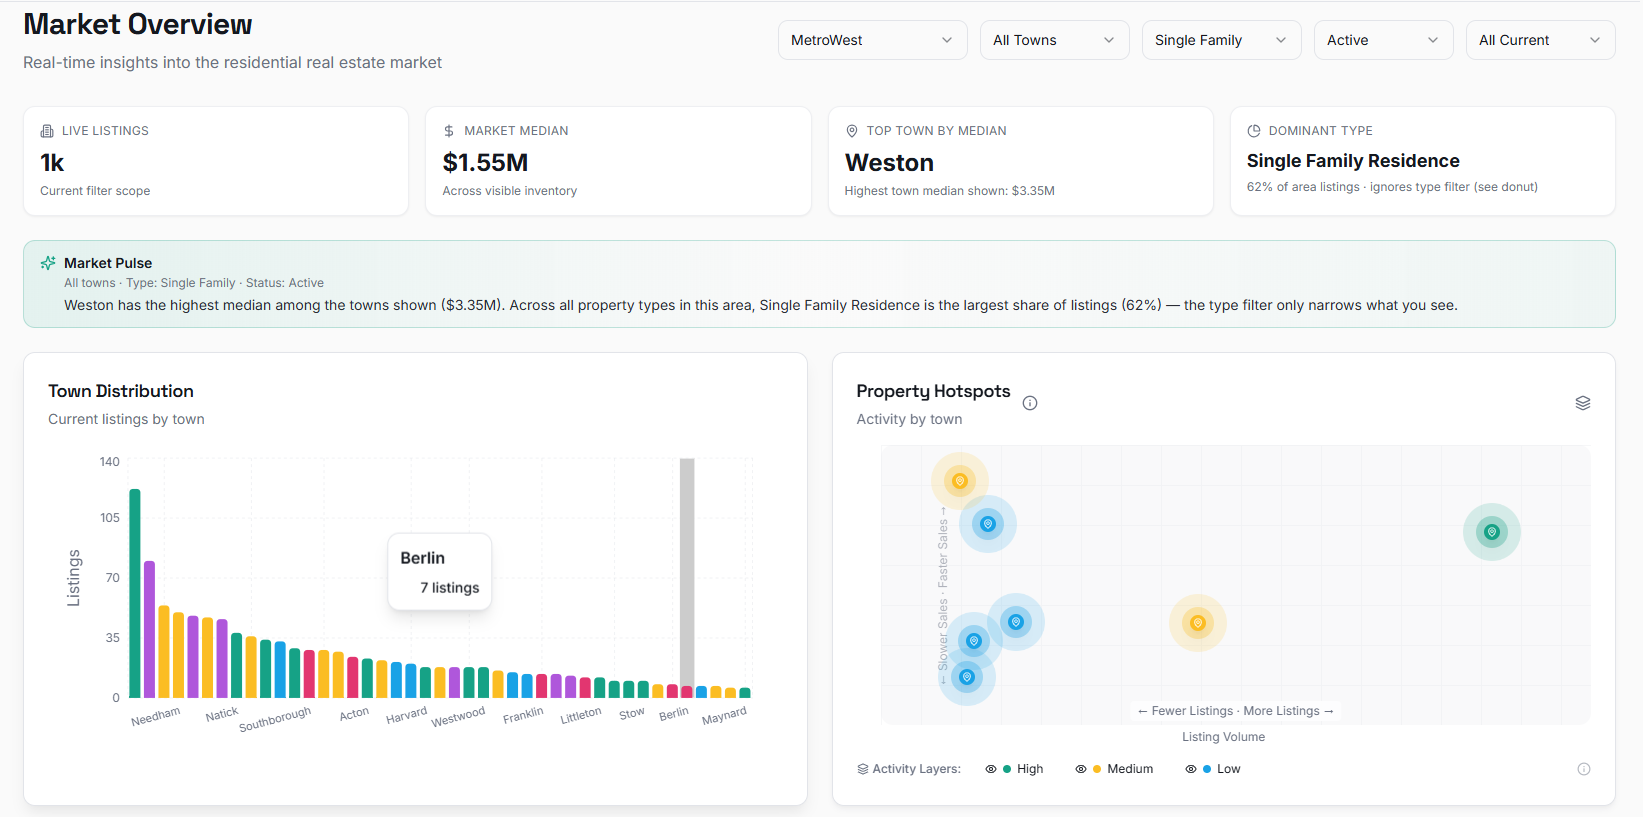
A real-time 'at a glance' view of current residential inventory for any geography — region, town, ZIP or property type. Executive stat cards surface live listings, market median price, the top town and the dominant property type, while a natural-language Market Pulse banner turns the raw numbers into plain-English insight — backed by price-by-town, inventory-by-type and price-trend charts. All aggregation runs client-side over live data, so filtered views stay meaningful.
Market Snapshot
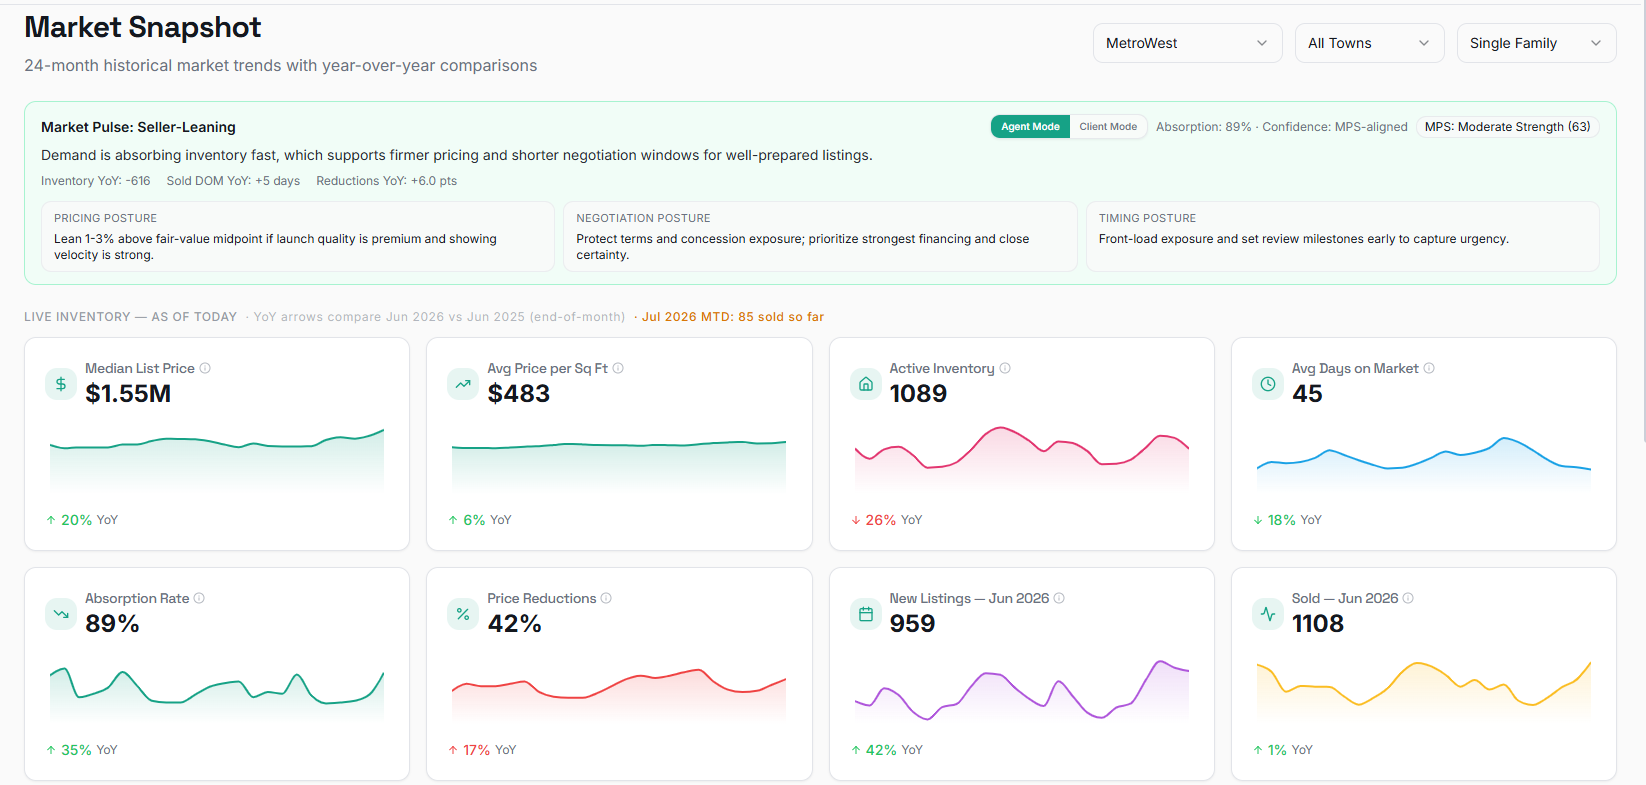
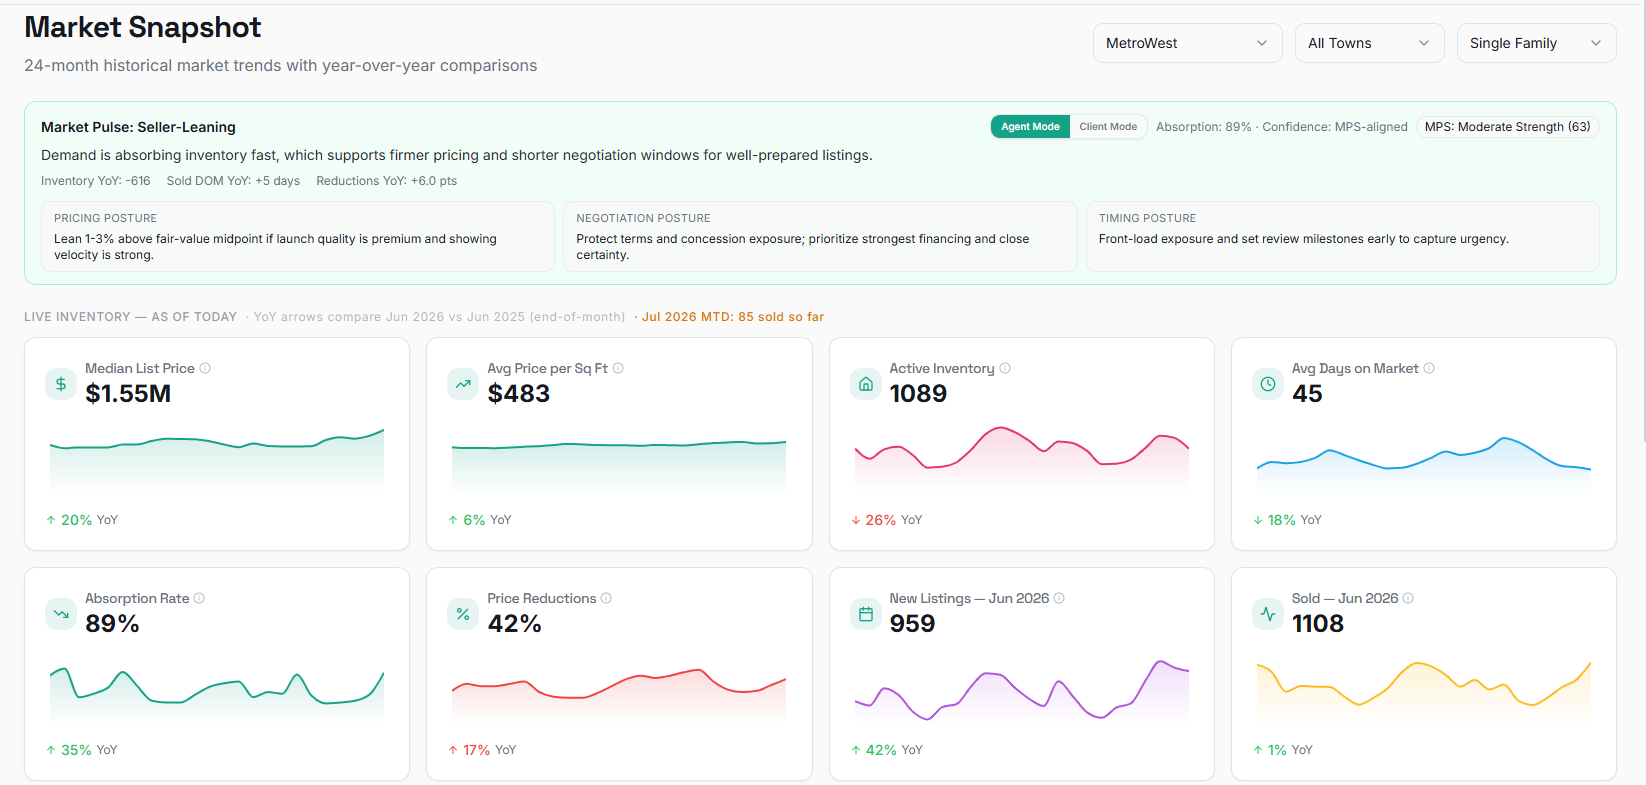
The historical, time-series counterpart to the Overview: 24 months of data with year-over-year comparisons. Sixteen metric cards — median sold price, price per sq ft, inventory, days on market, absorption, price cuts and volume — carry sparklines and YoY badges alongside four 24-month trend charts. A strategic Market Pulse panel classifies the market as seller-leaning, balanced or buyer-leaning (cross-checked against the Market PowerScore), and an Agent/Client toggle rephrases the guidance for either audience.
Market PowerScore
The flagship feature: a composite 0–100 score of how strongly a market favours sellers or buyers, built from four weighted pillars — momentum, structural imbalance, pricing reaction and macro durability — mapped to bands from Weak to Peak Strength. A forecasting model projects the score 30/60/90 days out with a probability for each band, and a rule-based engine writes plain-English interpretations and outlooks (no AI calls). A cross-town ranking compares whole markets by strength; scores come from cached daily snapshots and recompute live on filter.
CMA Generator
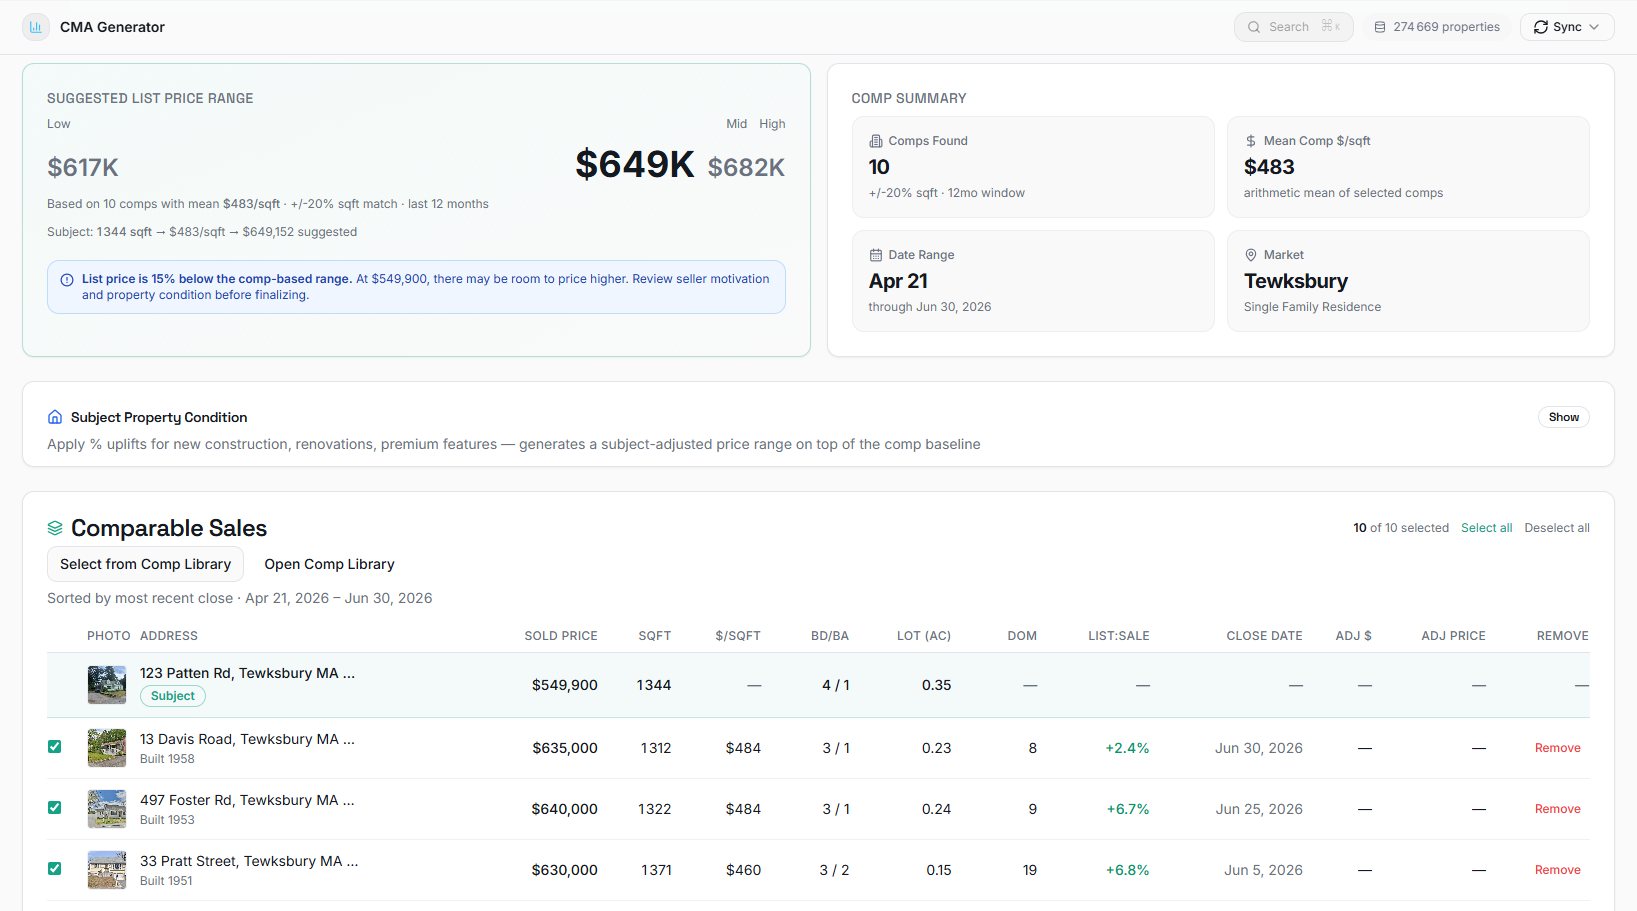
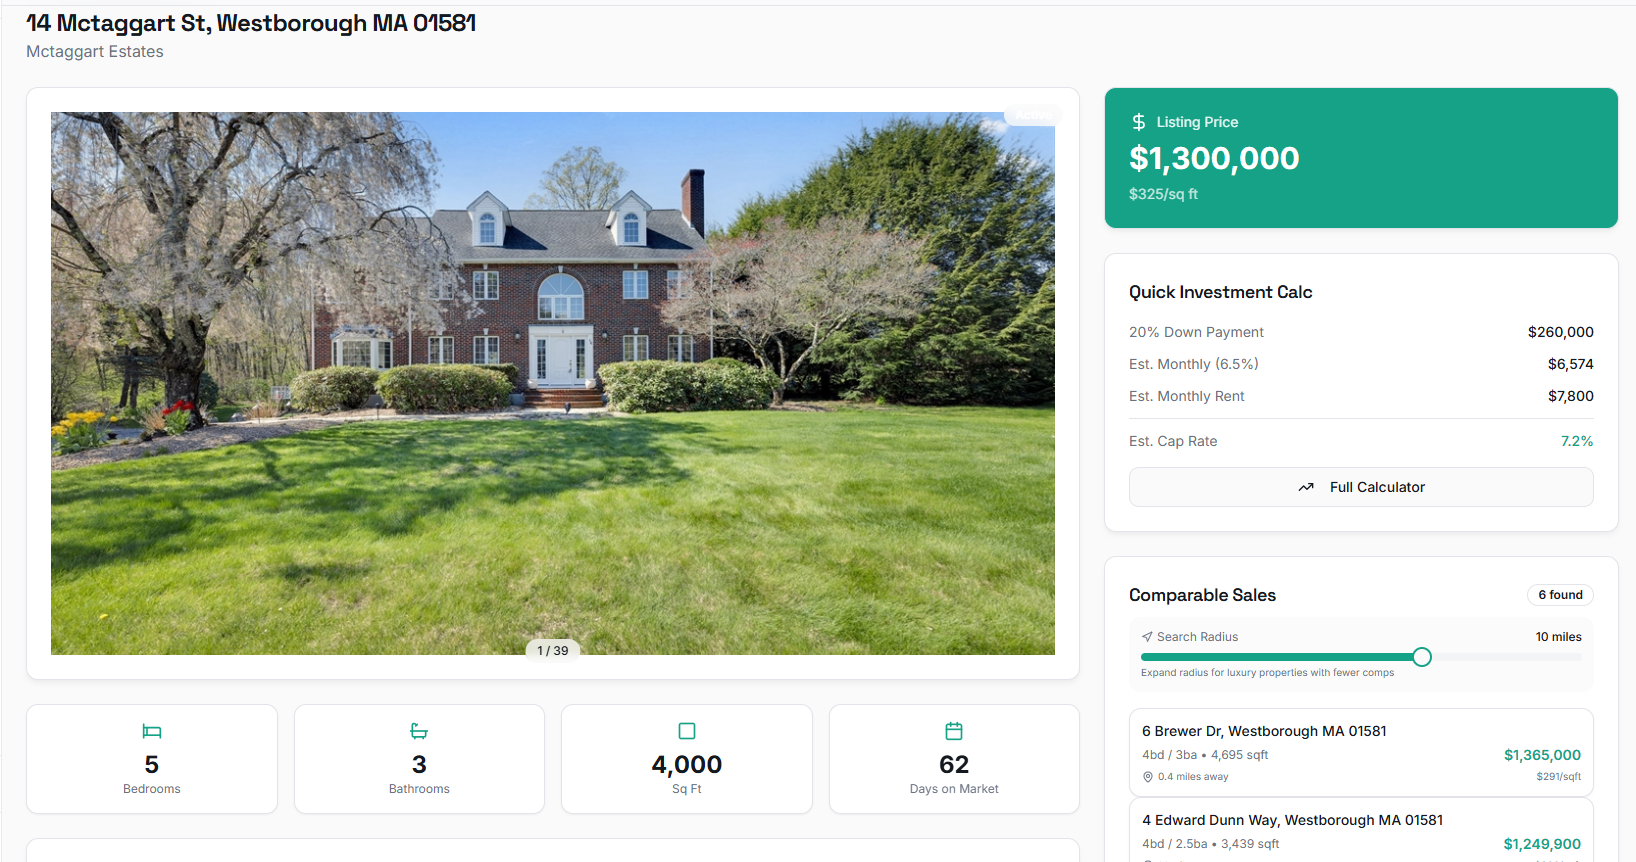
A one-click Comparative Market Analysis that produces presentation-ready valuations. An agent enters an address; the system resolves the property, pulls the best sold comparables — from MLS closed sales and a private off-market library, widening the search until enough quality comps are found — and returns a suggested list-price range with live market context. Valuation is median price-per-sq-ft across comps, anchored by a time-adjusted last sale. Agents curate comps, apply per-comp and condition adjustments, and switch between Seller and Buyer modes — then export a branded PDF bundling a price-vs-sqft scatter, comps table, market conditions, PowerScore and seasonal timing.

Market Opportunities
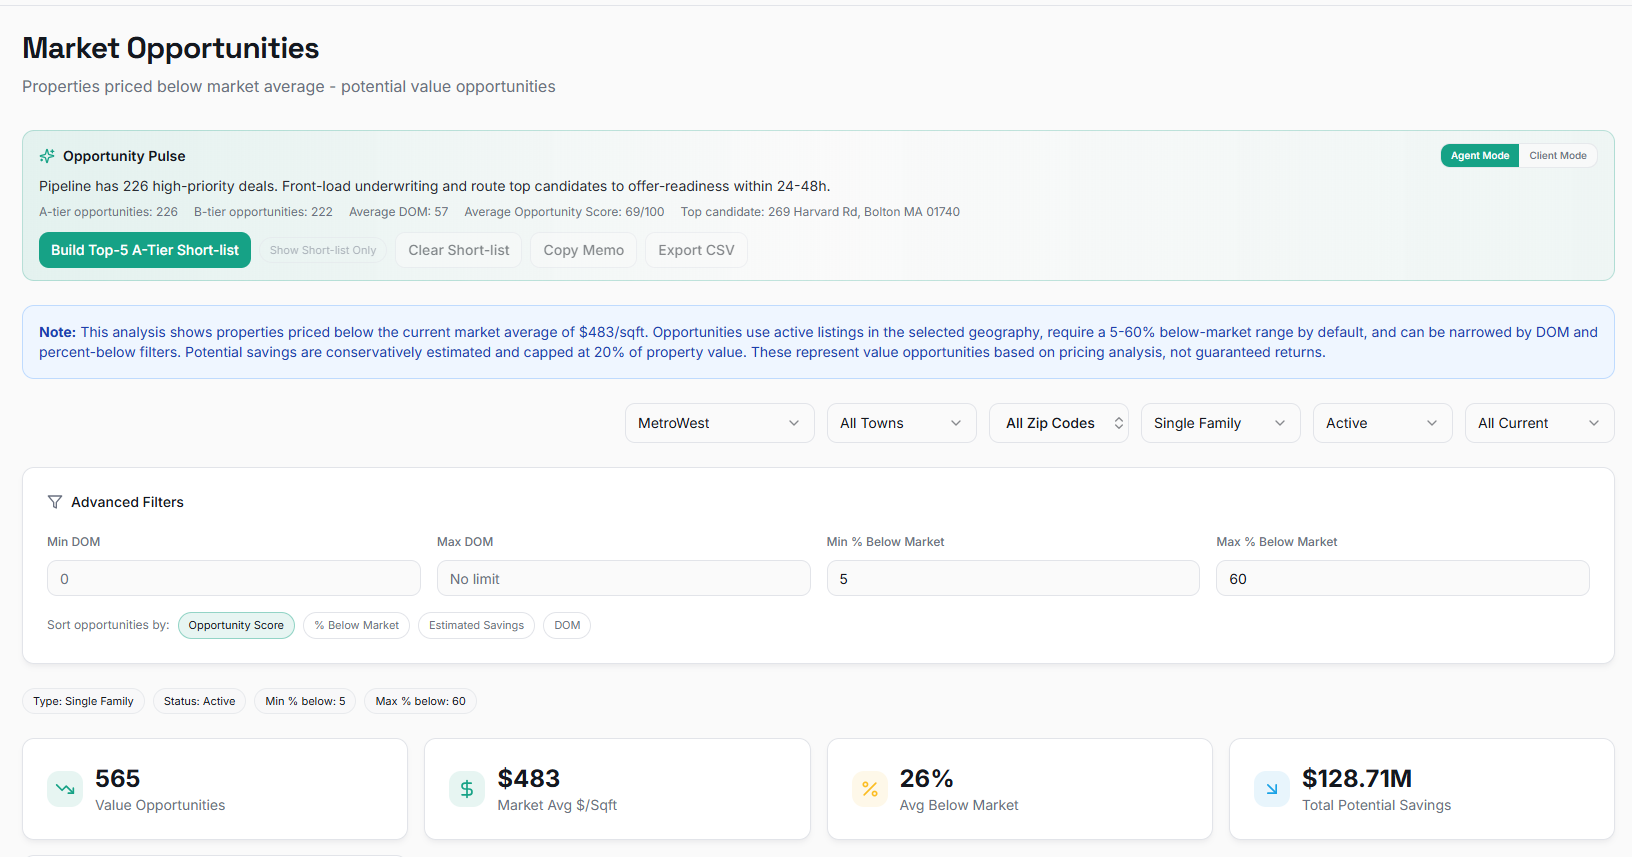
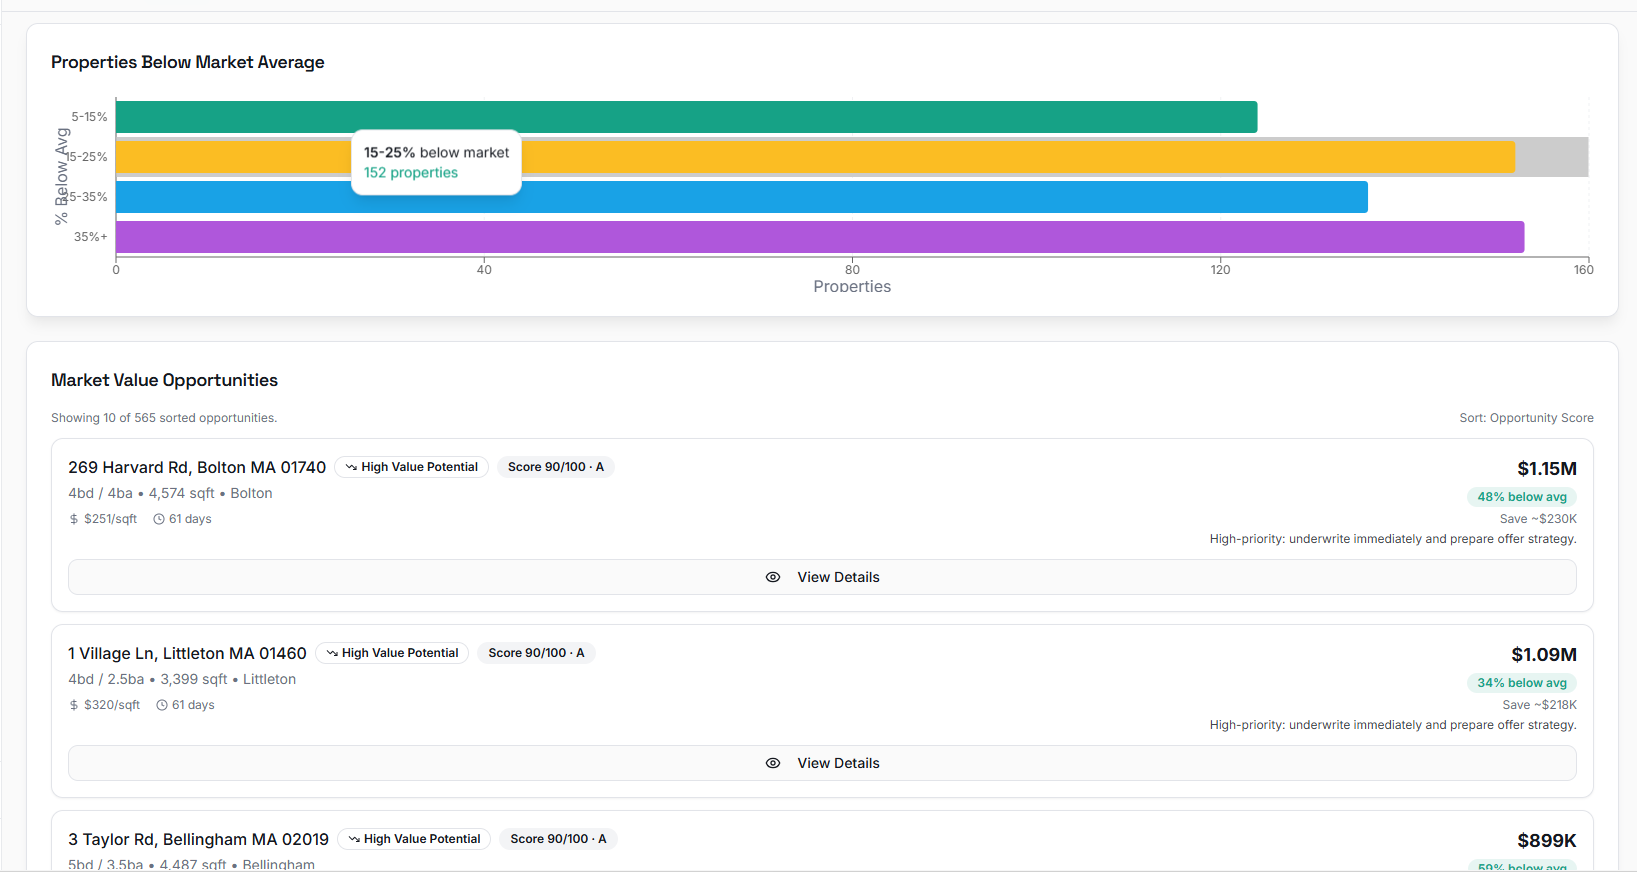
A value-detection tool that surfaces underpriced active listings — homes priced meaningfully below the market's average price-per-sq-ft, especially ones lingering on the market (potential motivated sellers). Each listing gets a 0–100 Opportunity Score blending discount depth vs market $/sqft, days on market and estimated dollar savings, mapped to A/B/C tiers — each paired with an agent playbook (underwrite now / monitor / watchlist). Agents filter by discount and days-on-market, auto-build a Top-5 A-tier shortlist, and export to CSV or a copy-ready memo, with an Agent/Client toggle and a below-market distribution chart. It's framed as a value-gap estimator, not a guarantee — savings are modeled, not promised.
Best Time to Sell
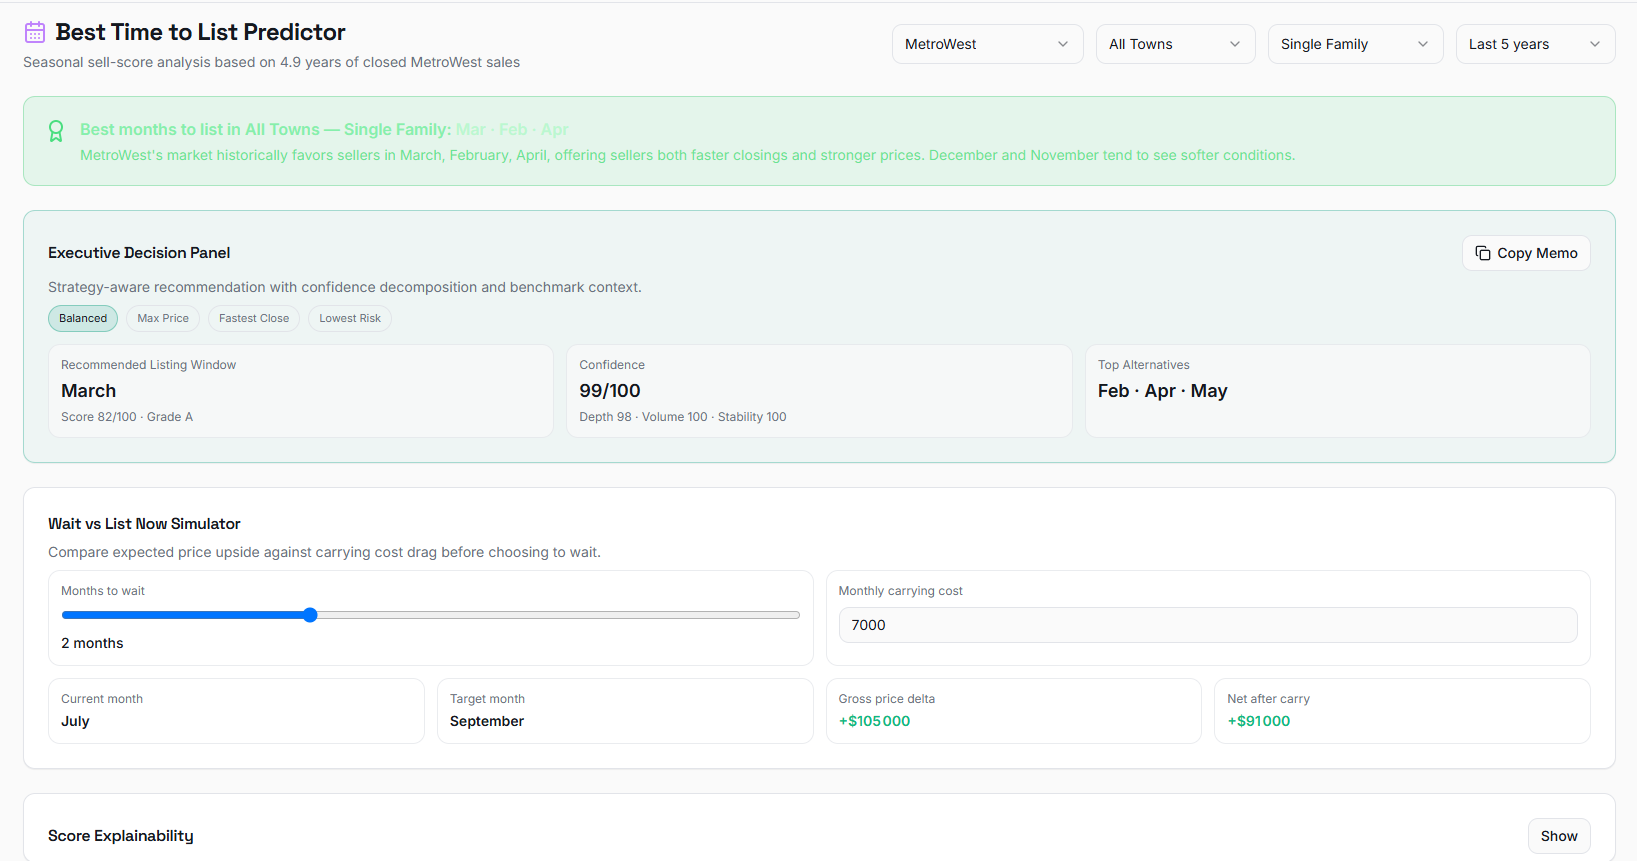
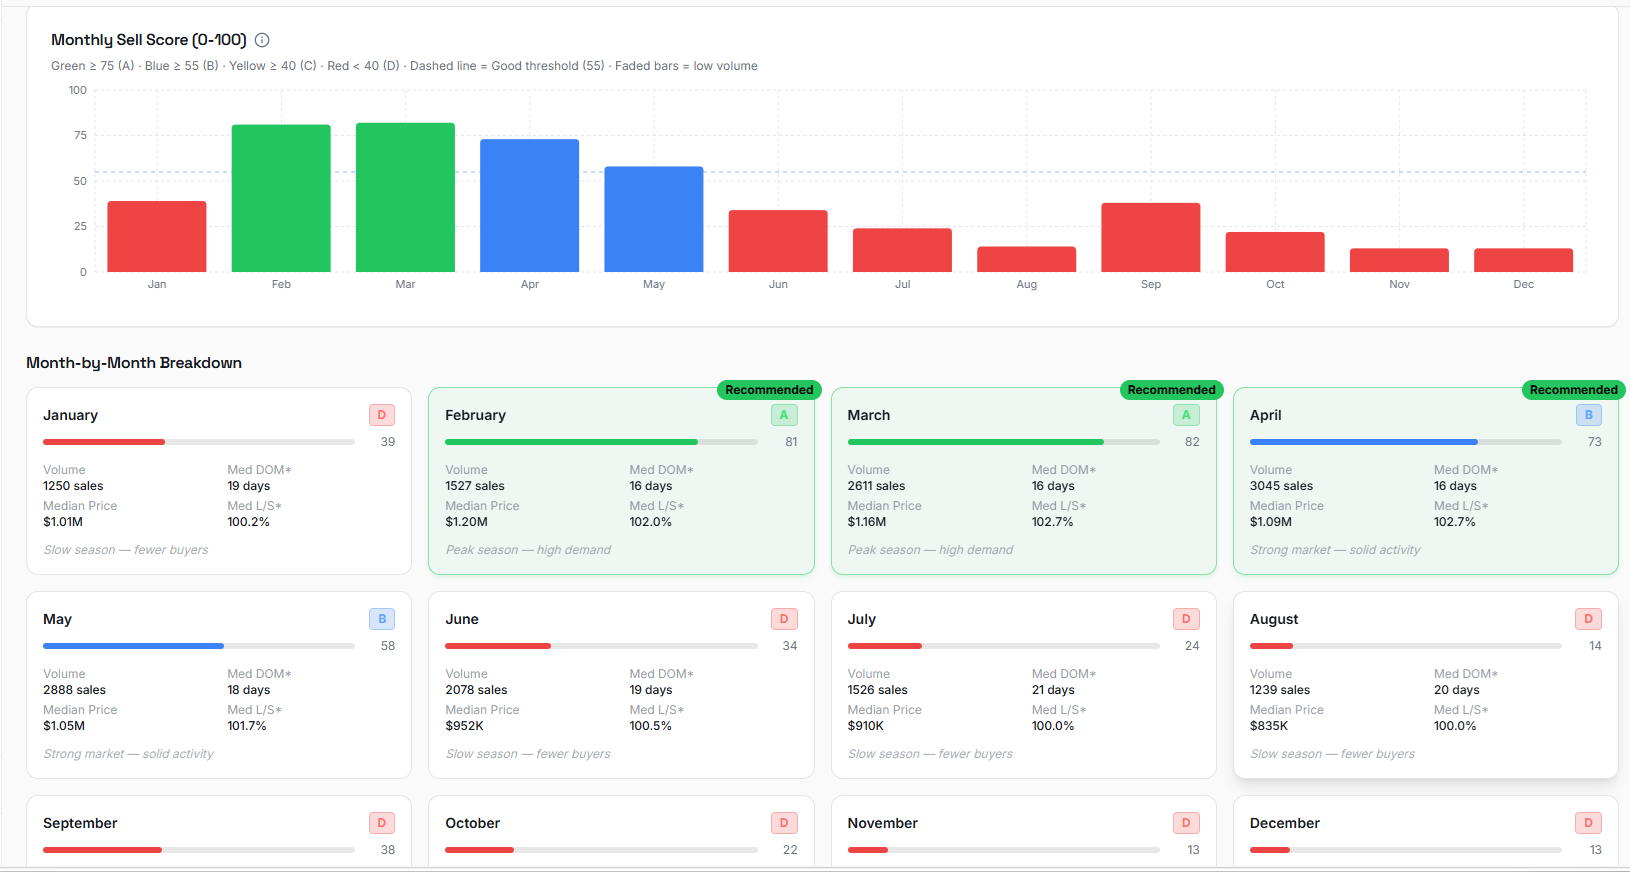
A seasonality predictor that tells a seller which calendar months historically produce the best selling outcomes in their specific market. It analyzes years of closed MLS sales (a configurable 3 / 5 / 20-year window), scoring each month 0–100 on a weighted Sell Score — median close price, sale speed and list-to-sold ratio — using medians to resist outliers and guards to exclude thin-sample months. On top of the ranking, a decision layer adds strategy modes (Balanced, Max Price, Fastest Close, Lowest Risk), a decomposed confidence score, a 'Wait vs. Now' simulator that nets projected price gains against carrying costs, and a town-vs-metro benchmark — surfaced as a color-coded score chart, a 12-month grid and a copy-ready memo.
Best Time to Buy
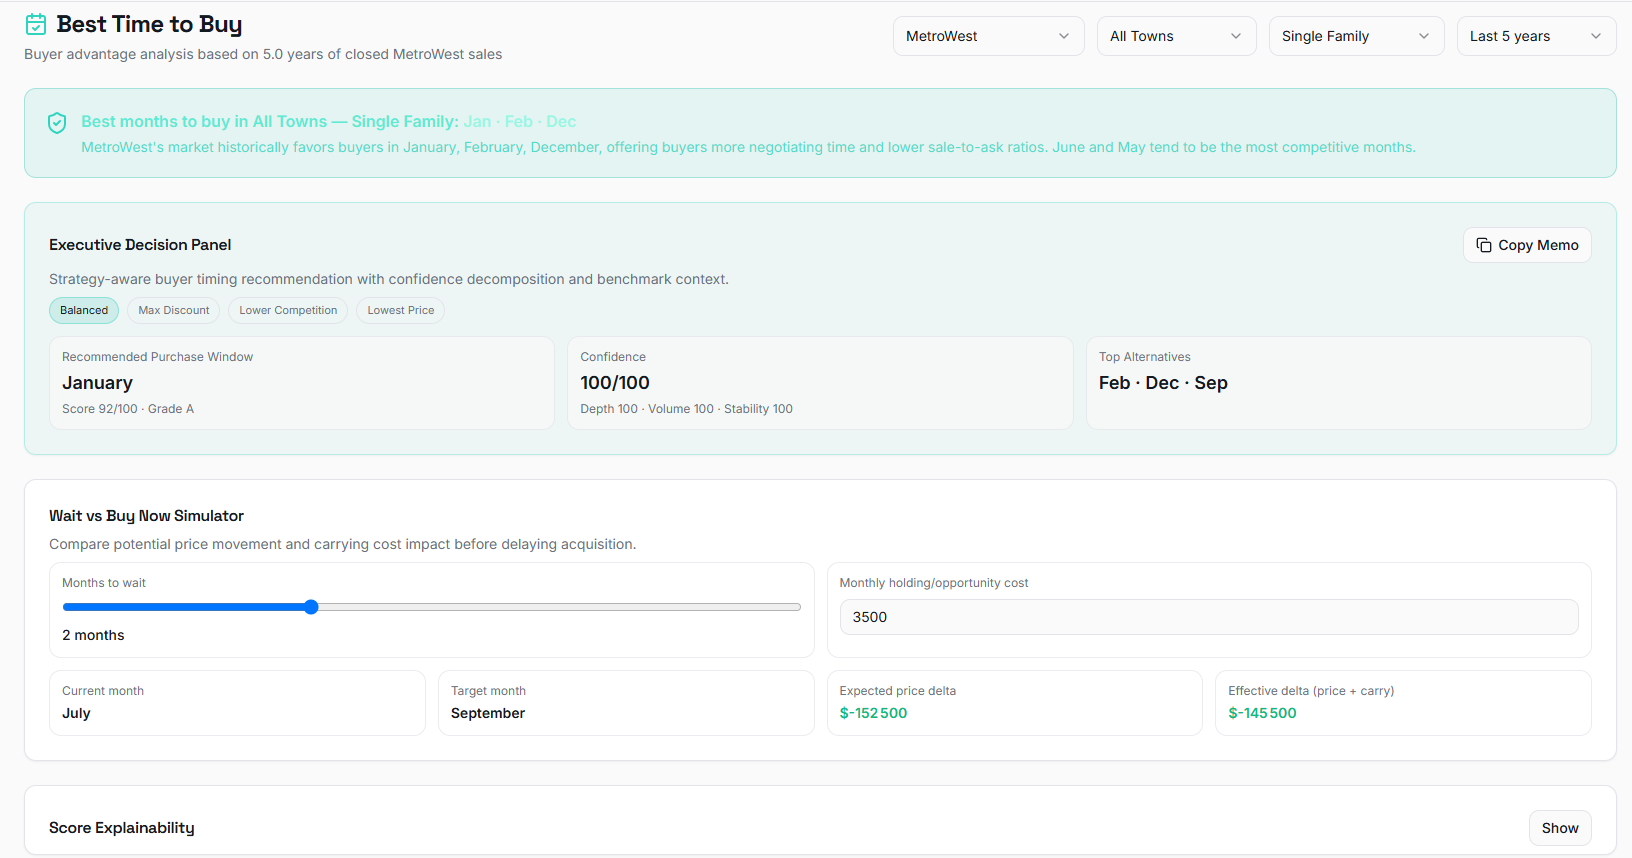
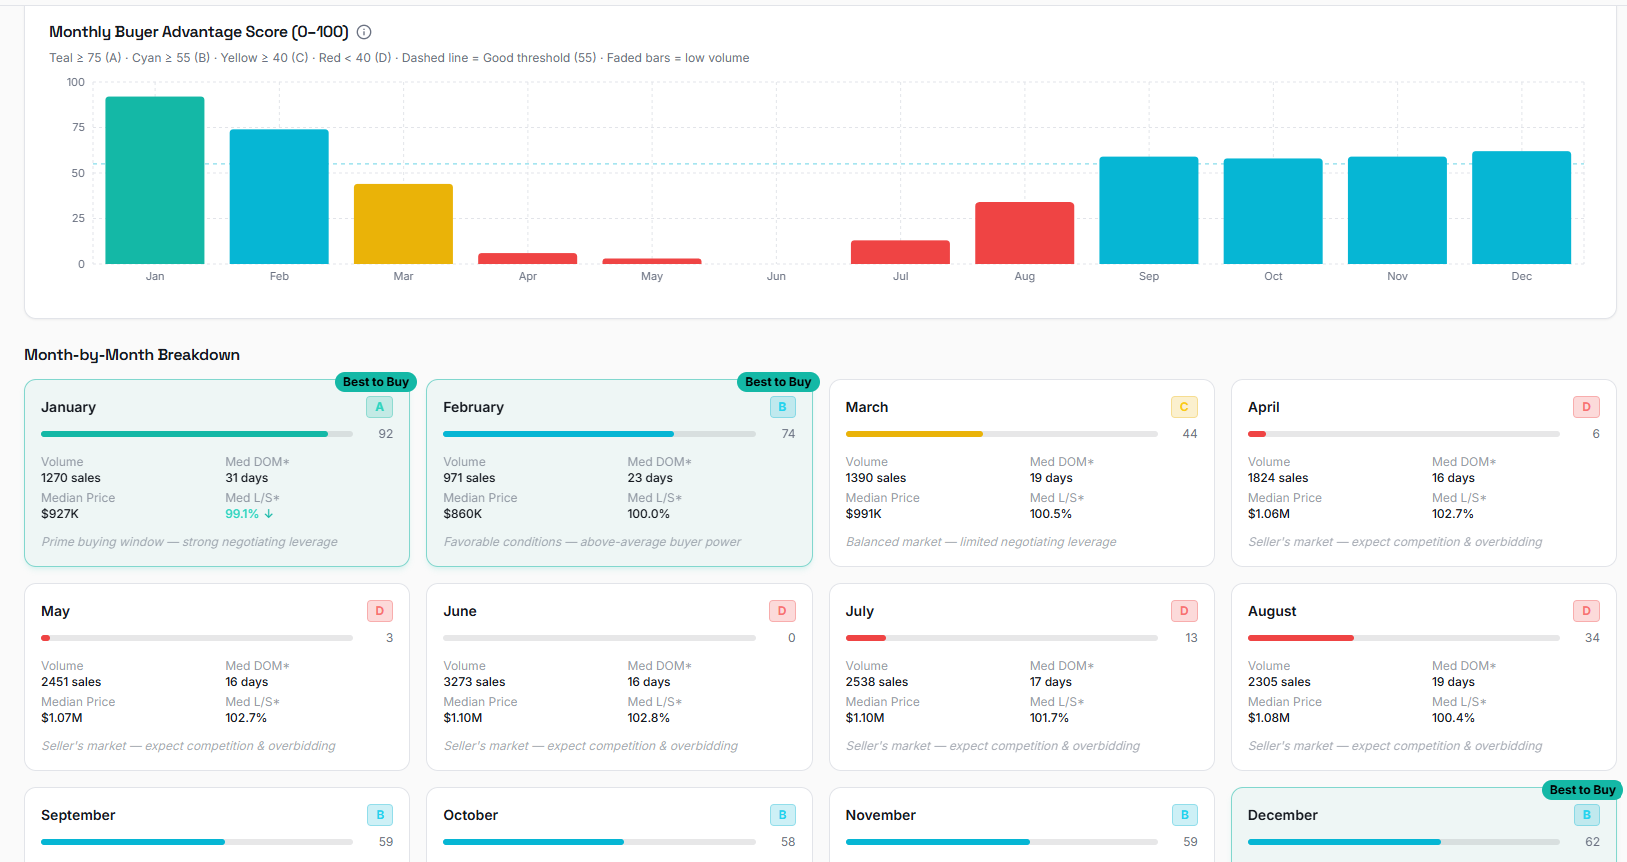
The mirror image of Best Time to Sell, built on the same engine but inverted to reveal when buyers hold the most negotiating leverage. It buckets closed sales by close-date month and computes a Buyer Advantage Score weighting the buyer-favoring signals — low list-to-sold ratio, high days on market and price softness. High-scoring months are when homes sit longest and sellers accept below asking; D-grade months warn of competitive seller's markets. It carries the same tooling — buyer strategy modes, a confidence breakdown, a carrying-cost-aware wait simulator, and explainability bars for each signal's contribution — plus a 'how to read this' callout that makes the inverse relationship explicit.
Seller Listing Intel
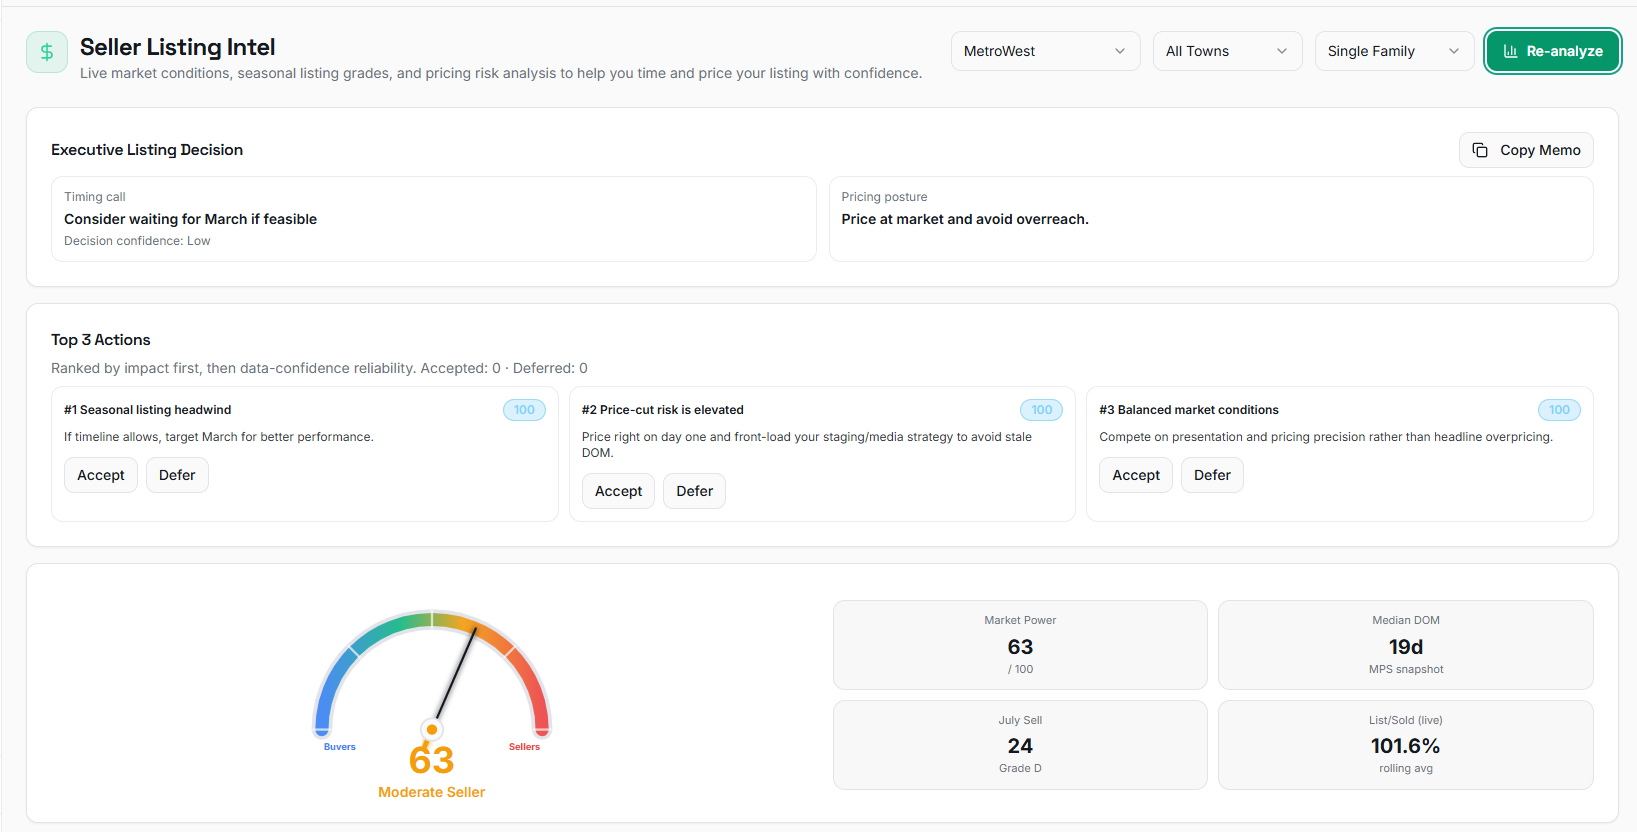
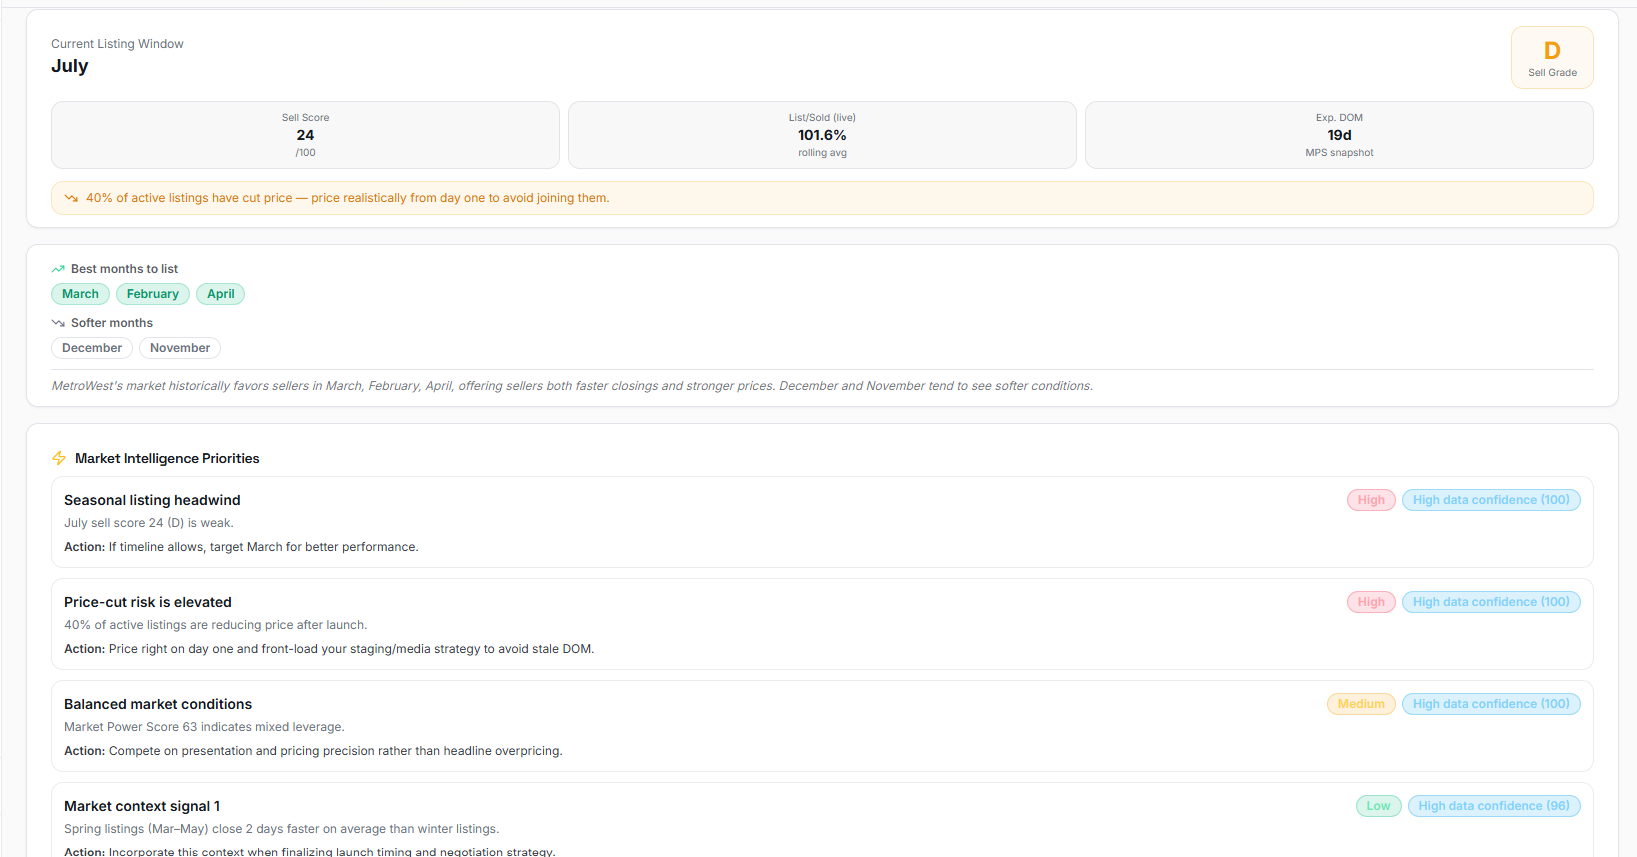
A decision-support dashboard answering 'should I list now, and how should I price?'. It fuses three live layers for the selected market — the Market Power Score, the current month's seasonal Sell Grade, and live pricing signals (list-to-sold ratio, median days on market, price-reduction rate) — into an Executive Listing Decision: a timing call, a pricing posture and a confidence level. It distills a ranked 'Top 3 Actions', each with an impact rating and data-confidence score, that sellers can accept or defer into a persistent Execution Journal and later log realized outcomes (Beat / Met / Missed) to track ROI. An animated market gauge, KPI tiles and a copy-ready memo round out the view.
Buyer Offer Intel
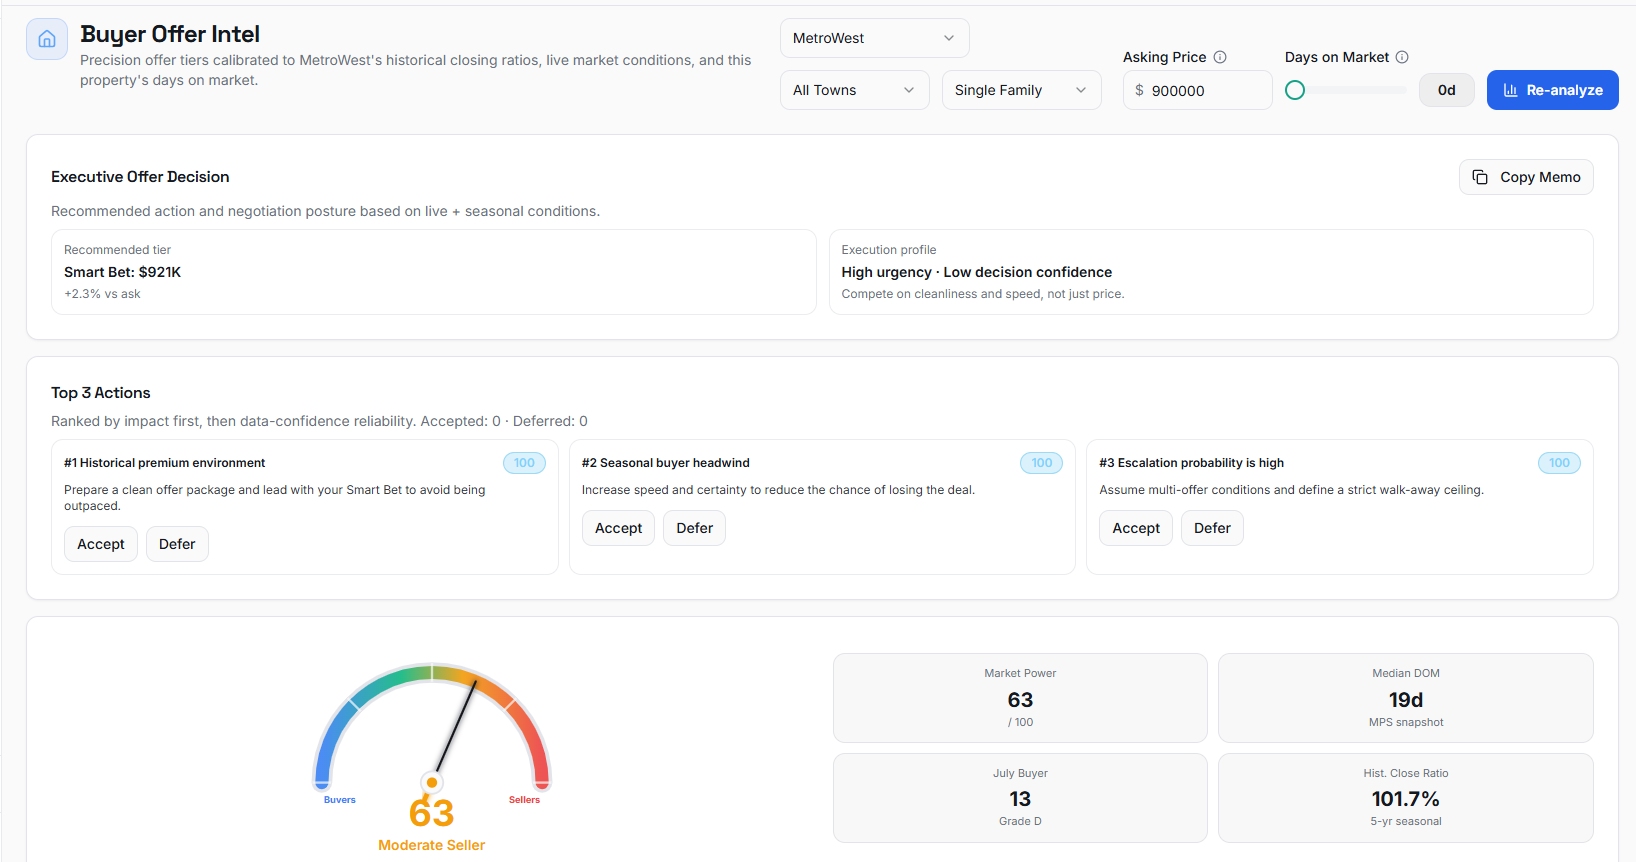
A precision offer-pricing tool that, for a specific property's asking price and days on market, generates three calibrated offer tiers anchored to the market's historical closing ratios. From an anchor (asking × the month's median list-to-sold ratio) it applies a days-on-market leverage discount and a Market-Power tilt to produce Conservative (maximum negotiating room), Smart Bet (the recommended tier) and Bold Move (built to win multi-offer situations), each rounded to the nearest $1,000. It layers on an Executive Offer Decision with an urgency read, confidence and negotiation posture, plus the same Top-3-Actions and Execution Journal workflow — surfacing signals like escalation probability, days-on-market leverage and the live seasonal Buy Grade through offer-tier cards, a market gauge and KPI tiles.

Building something like this?
If your operation is running on scattered spreadsheets and chats, I can help you turn it into one calm, predictable system.
Book a call